The system context your team keeps losing—finally in one place.
See how your UI flows, API specs, diagrams, schemas, and tests connect — automatically synced from your repo on every deploy.
How UiGraph works
Define services, build diagrams, map UI to backend, and add context where needed—so your team can understand and navigate the system.
Define your services
Each service is your anchor—add APIs, owners, dependencies, tests, and database schemas. Everything else in UiGraph connects back to it.
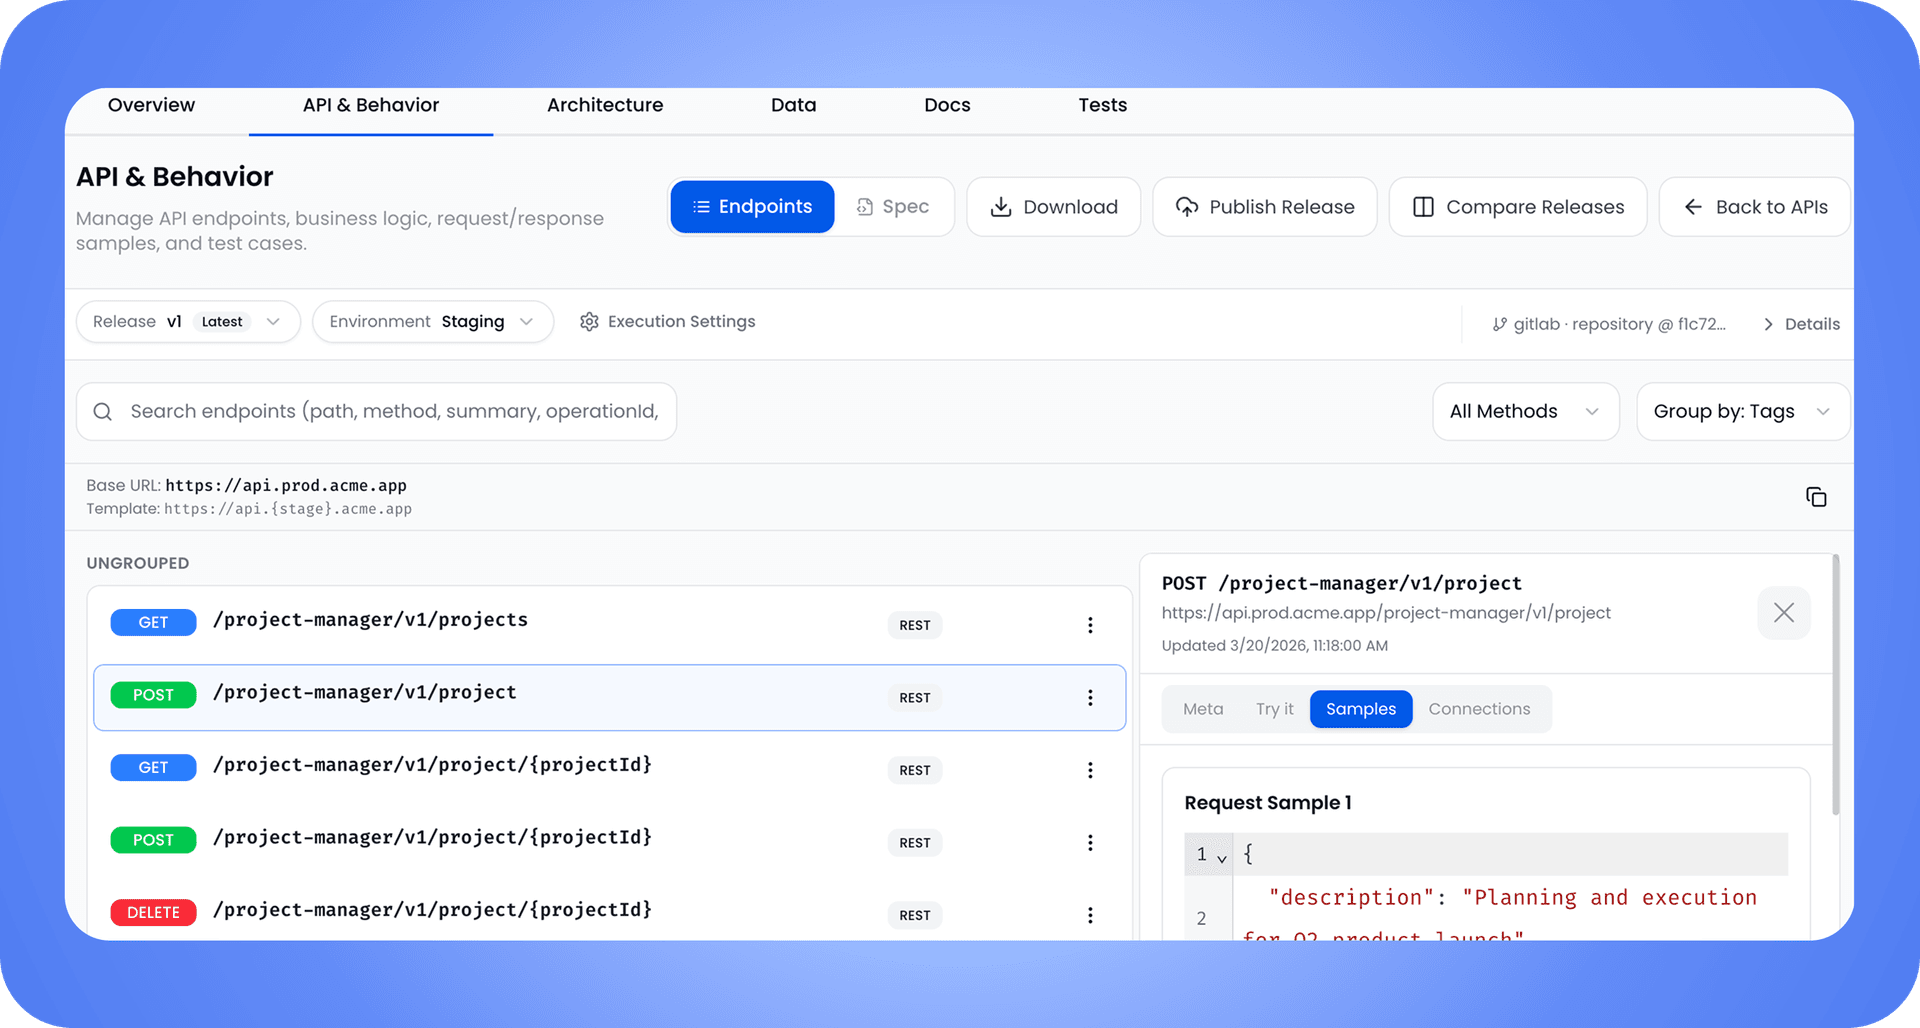
Paste an OpenAPI spec and every endpoint is indexed instantly
Teams always know where to look — no more "who owns this?"
Built for the questions engineers actually ask
Who owns this? What calls what? What does this screen connect to?—answered without leaving UiGraph.
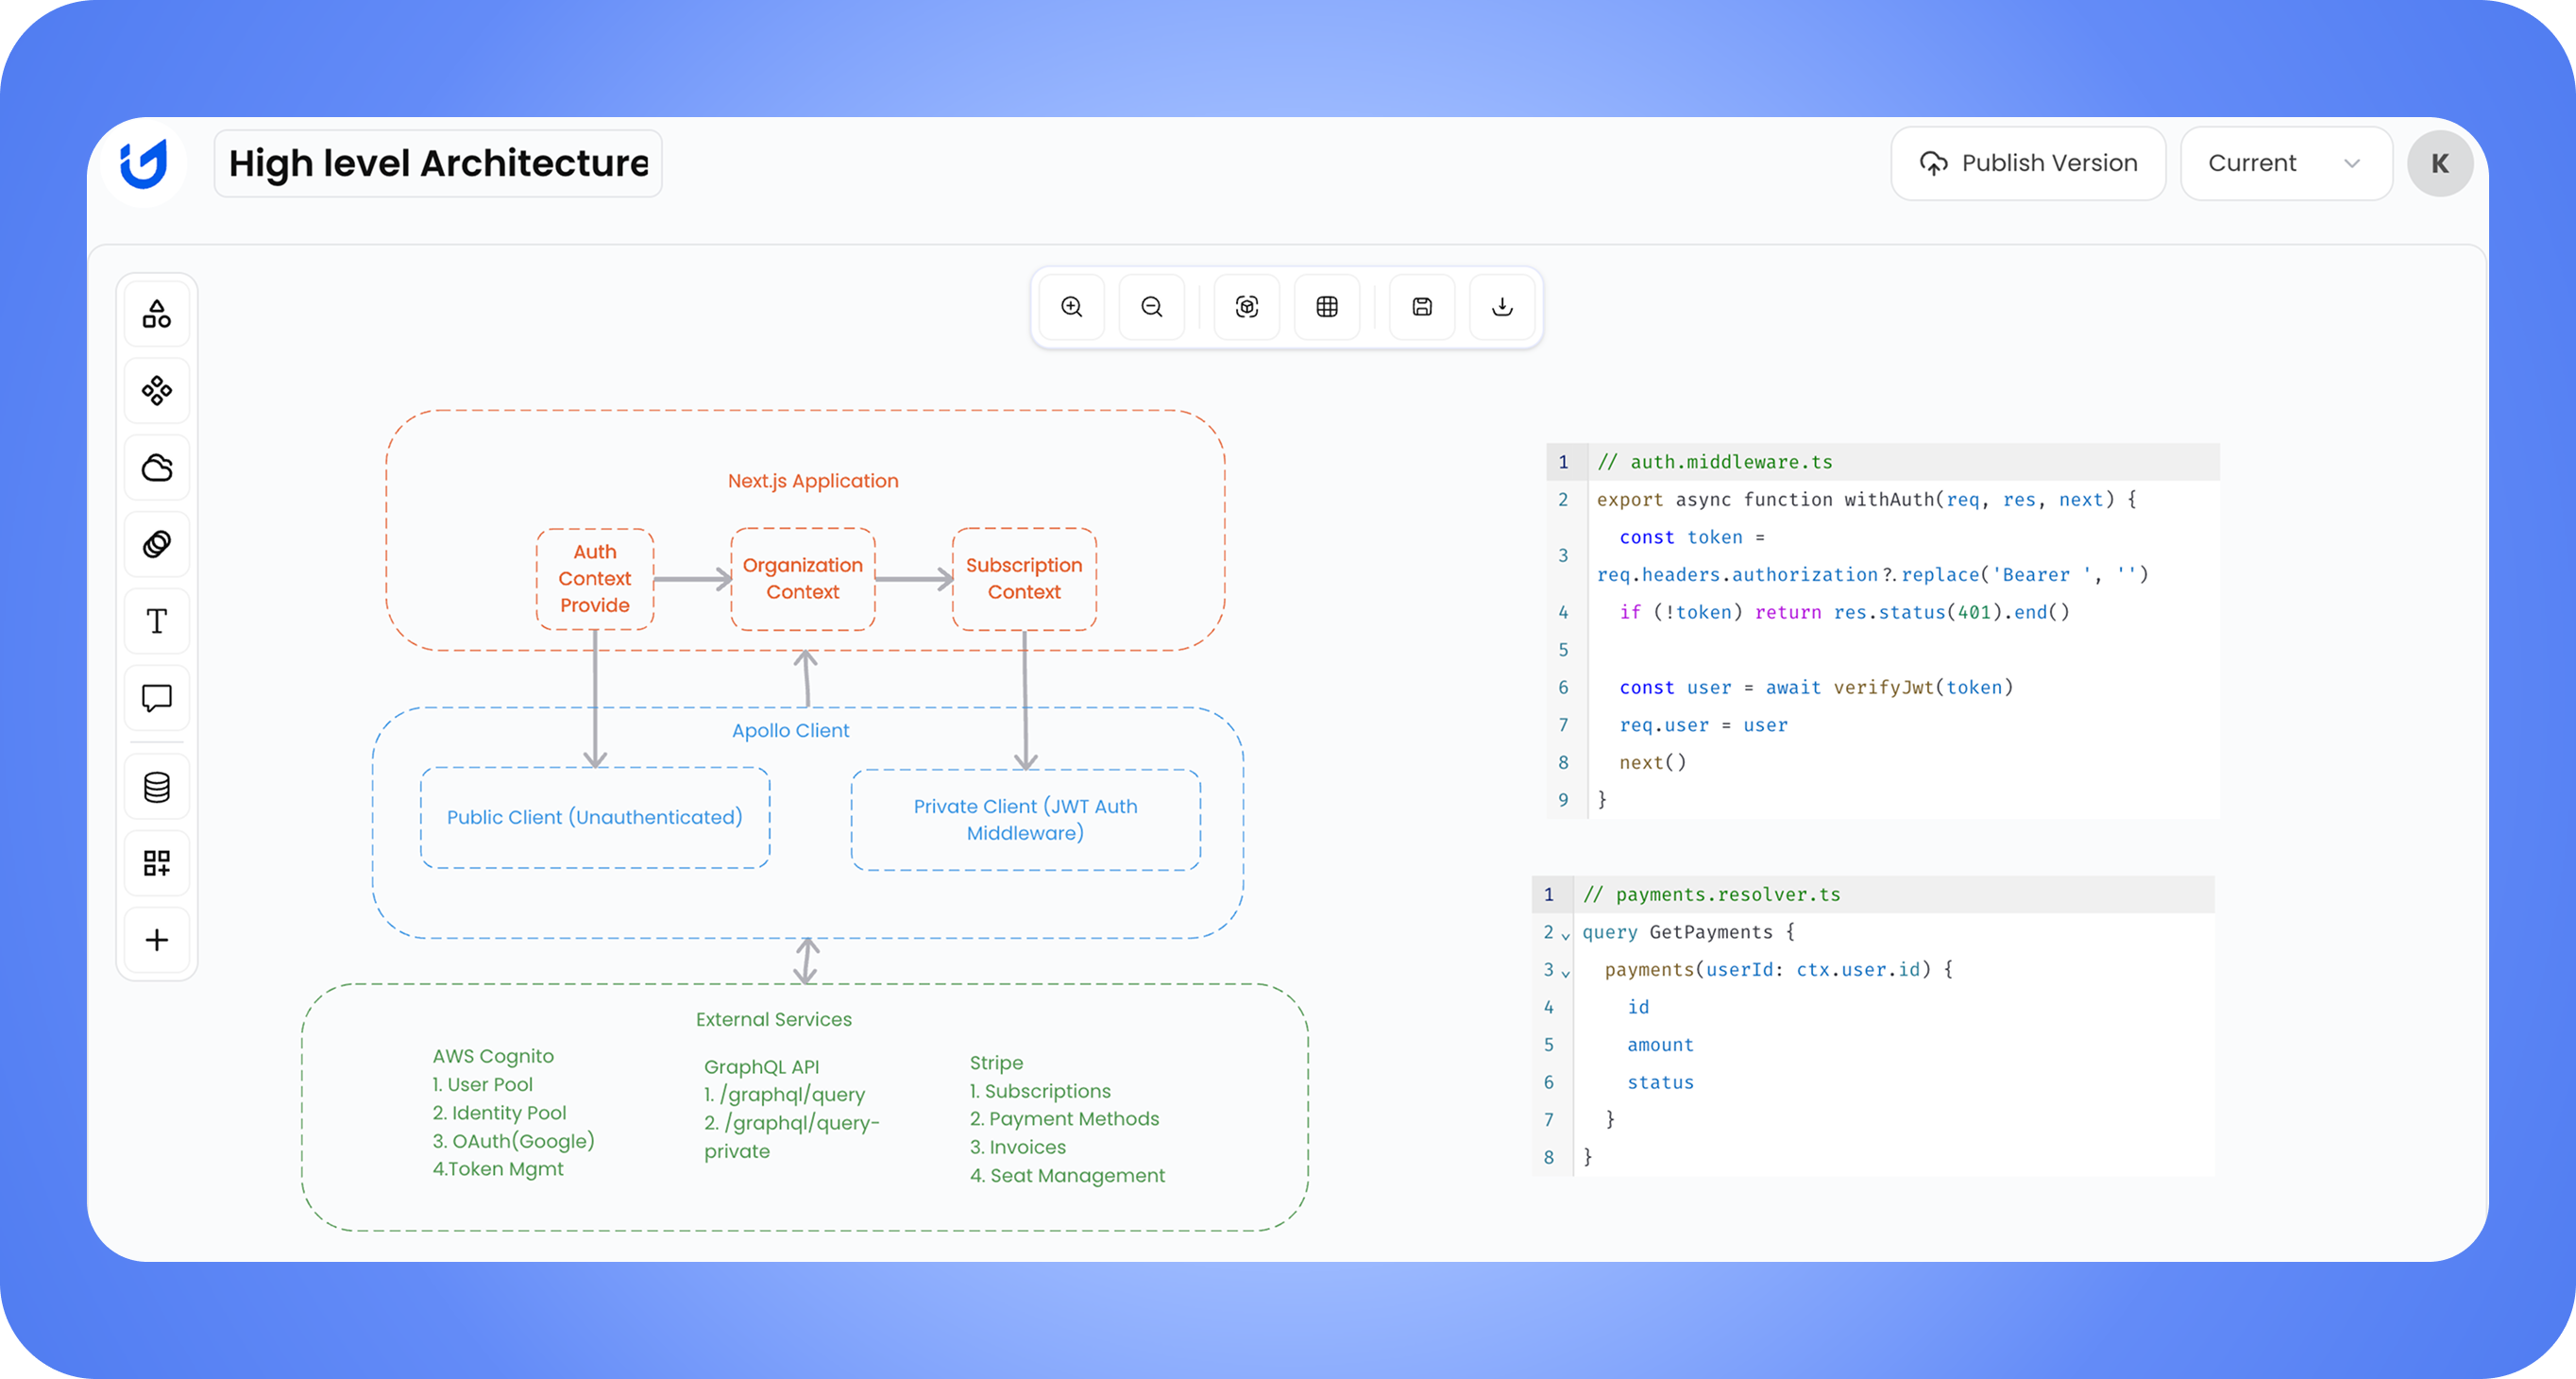
Understand the system before touching the code
Trace flows, dependencies, and API connections in UiGraph — so you already know what matters before opening your IDE.
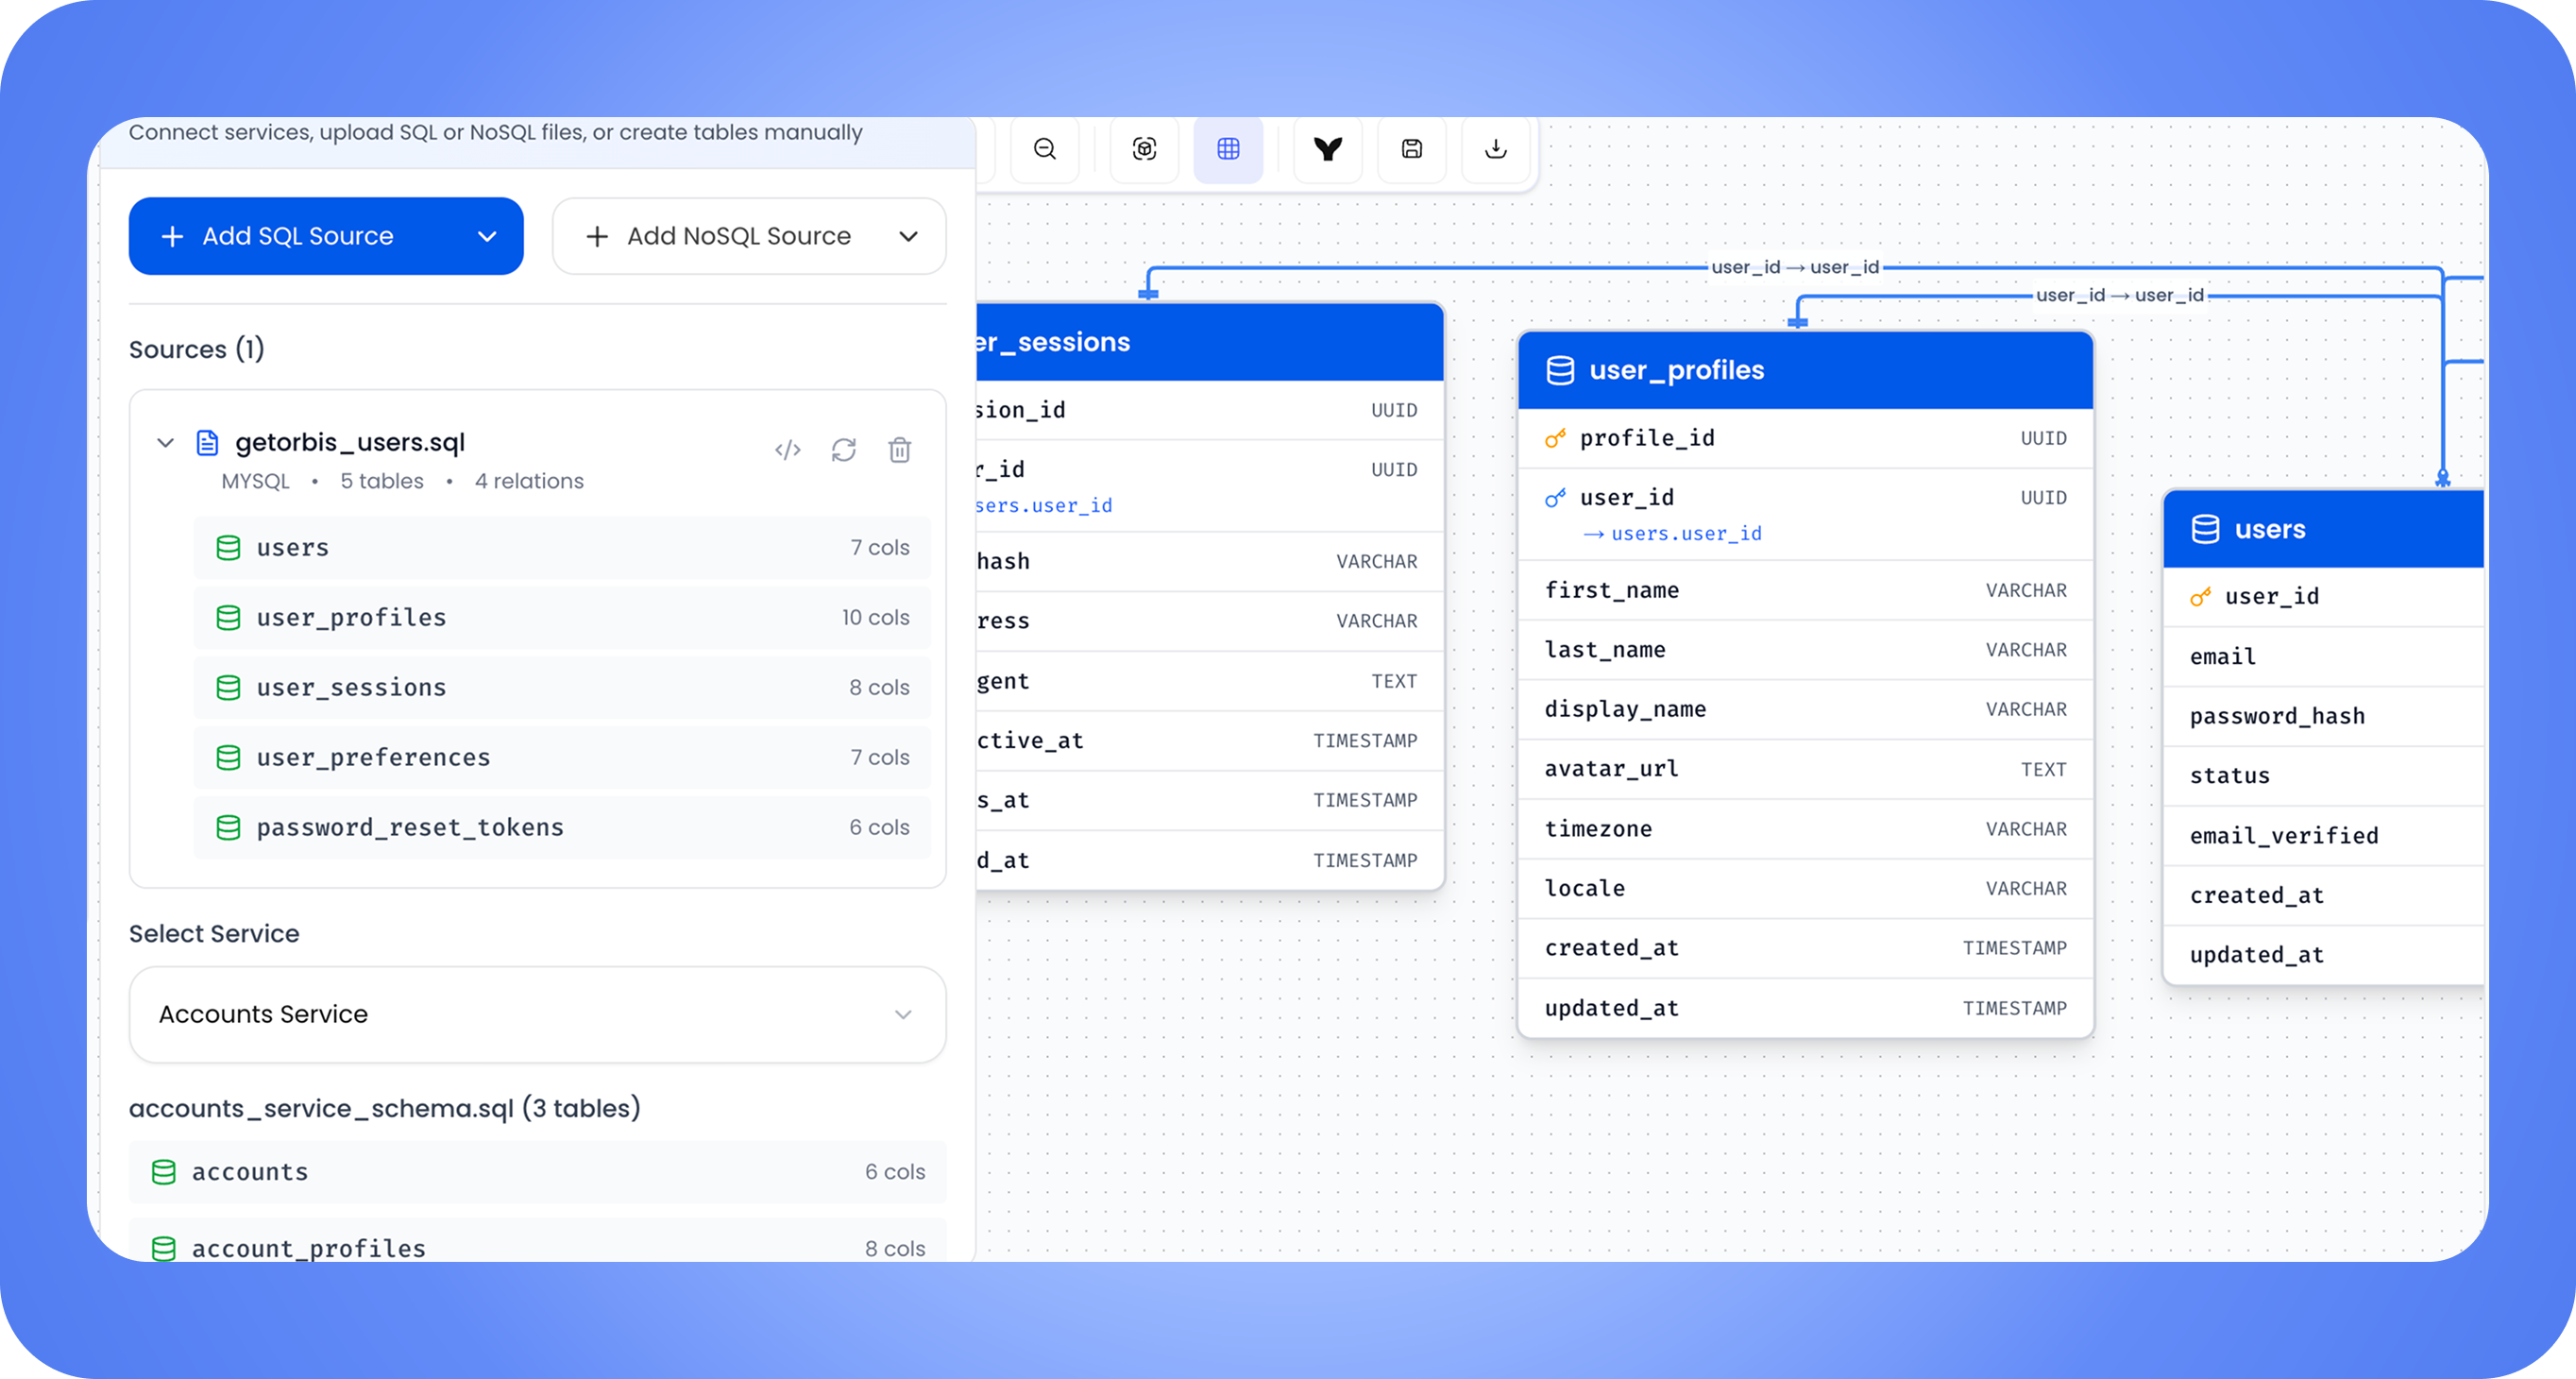
Your database, finally readable
Import SQL or NoSQL schemas and see every table, column, and relationship — mapped and visualized in one place.
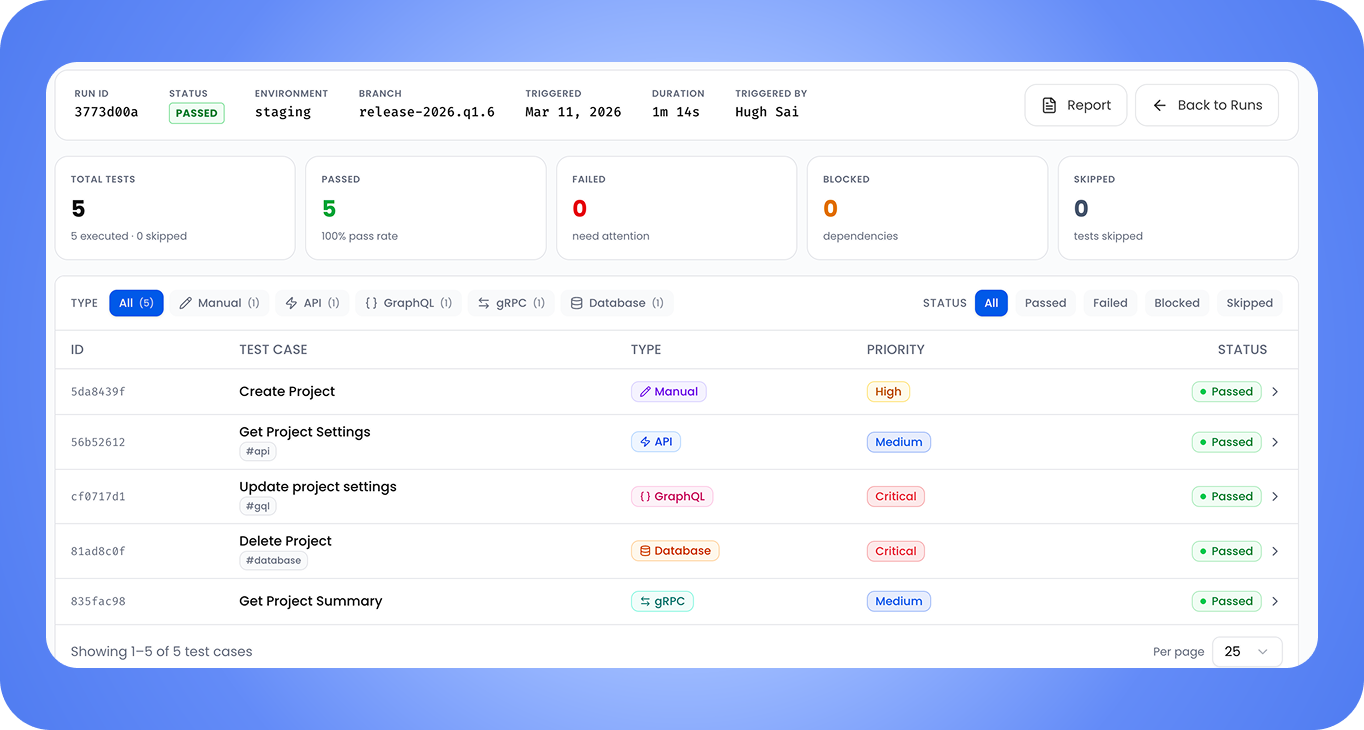
Testing built into your system context
Create test cases and test packs, run them, and track results against your services and UI screens — quality as part of the system, not bolted on.
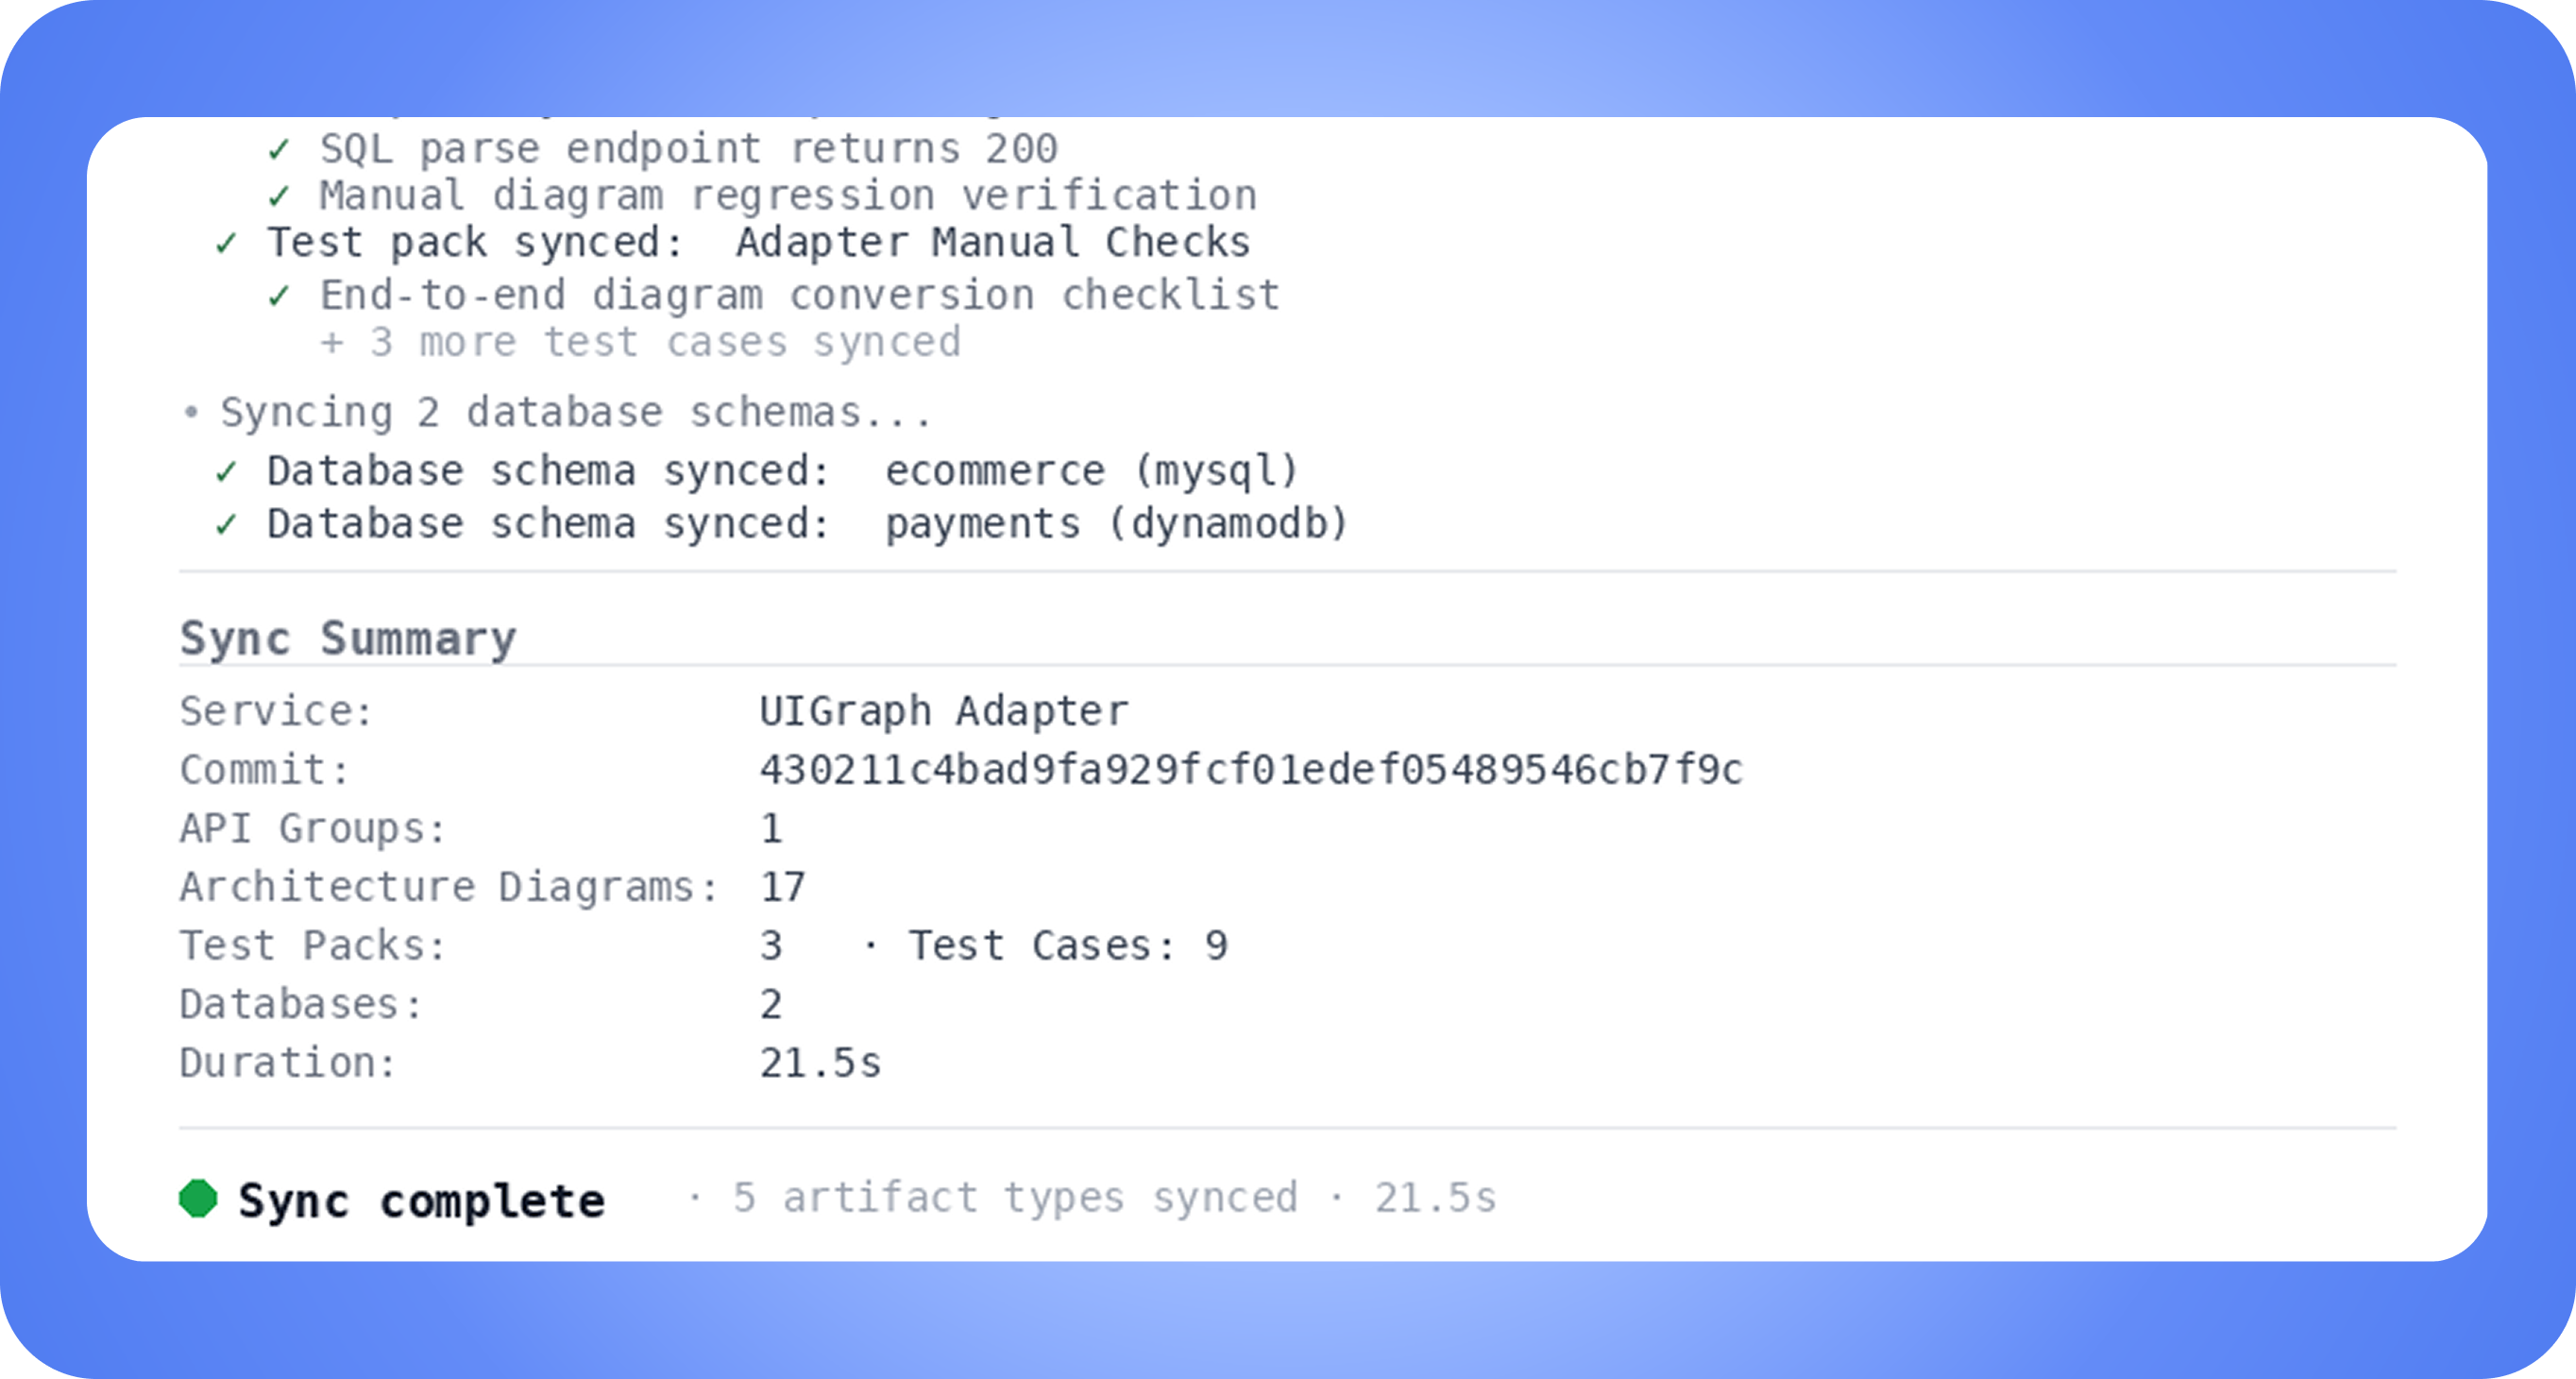
One command, Everything in sync
Add a .uigraph.yaml to your repo, run uigraph sync, and your services, API specs, diagrams, schemas, and tests stay current — automatically on every deploy.
Architecture
The best documentation is the kind that updates itself
Your system is already documented—in your repo, specs, schemas, and tests. UiGraph connects it and keeps it navigable.

Built for every team
One system map shared across product, engineering, design, QA, and ops — so no team is working blind.

Product Teams
Visualize user flows and backend logic to make informed product decisions — without waiting on an engineer to explain the system.

Engineering Teams
Understand UI-to-backend connections instantly. Stop context-switching between code, Slack, and outdated docs.

Design Teams
See which APIs and services power each screen before designing changes that break something downstream.

QA & Testing
Spot gaps and edge cases early using live flow diagrams and linked API specs — not guesswork.

Project Management
Track which services a feature touches and who owns each one — so nothing falls through the cracks at handoff.

DevOps & IT
See the full frontend-to-backend call chain for any feature — so incidents are faster to diagnose and fix.
See your system clearly—
starting today.
Add your first service and start connecting the pieces.