Architecture you canexplore.
Create C4, sequence, flow, and data diagrams. Add context to components so you can understand the details behind the picture, and keep diagrams in sync with your repo.
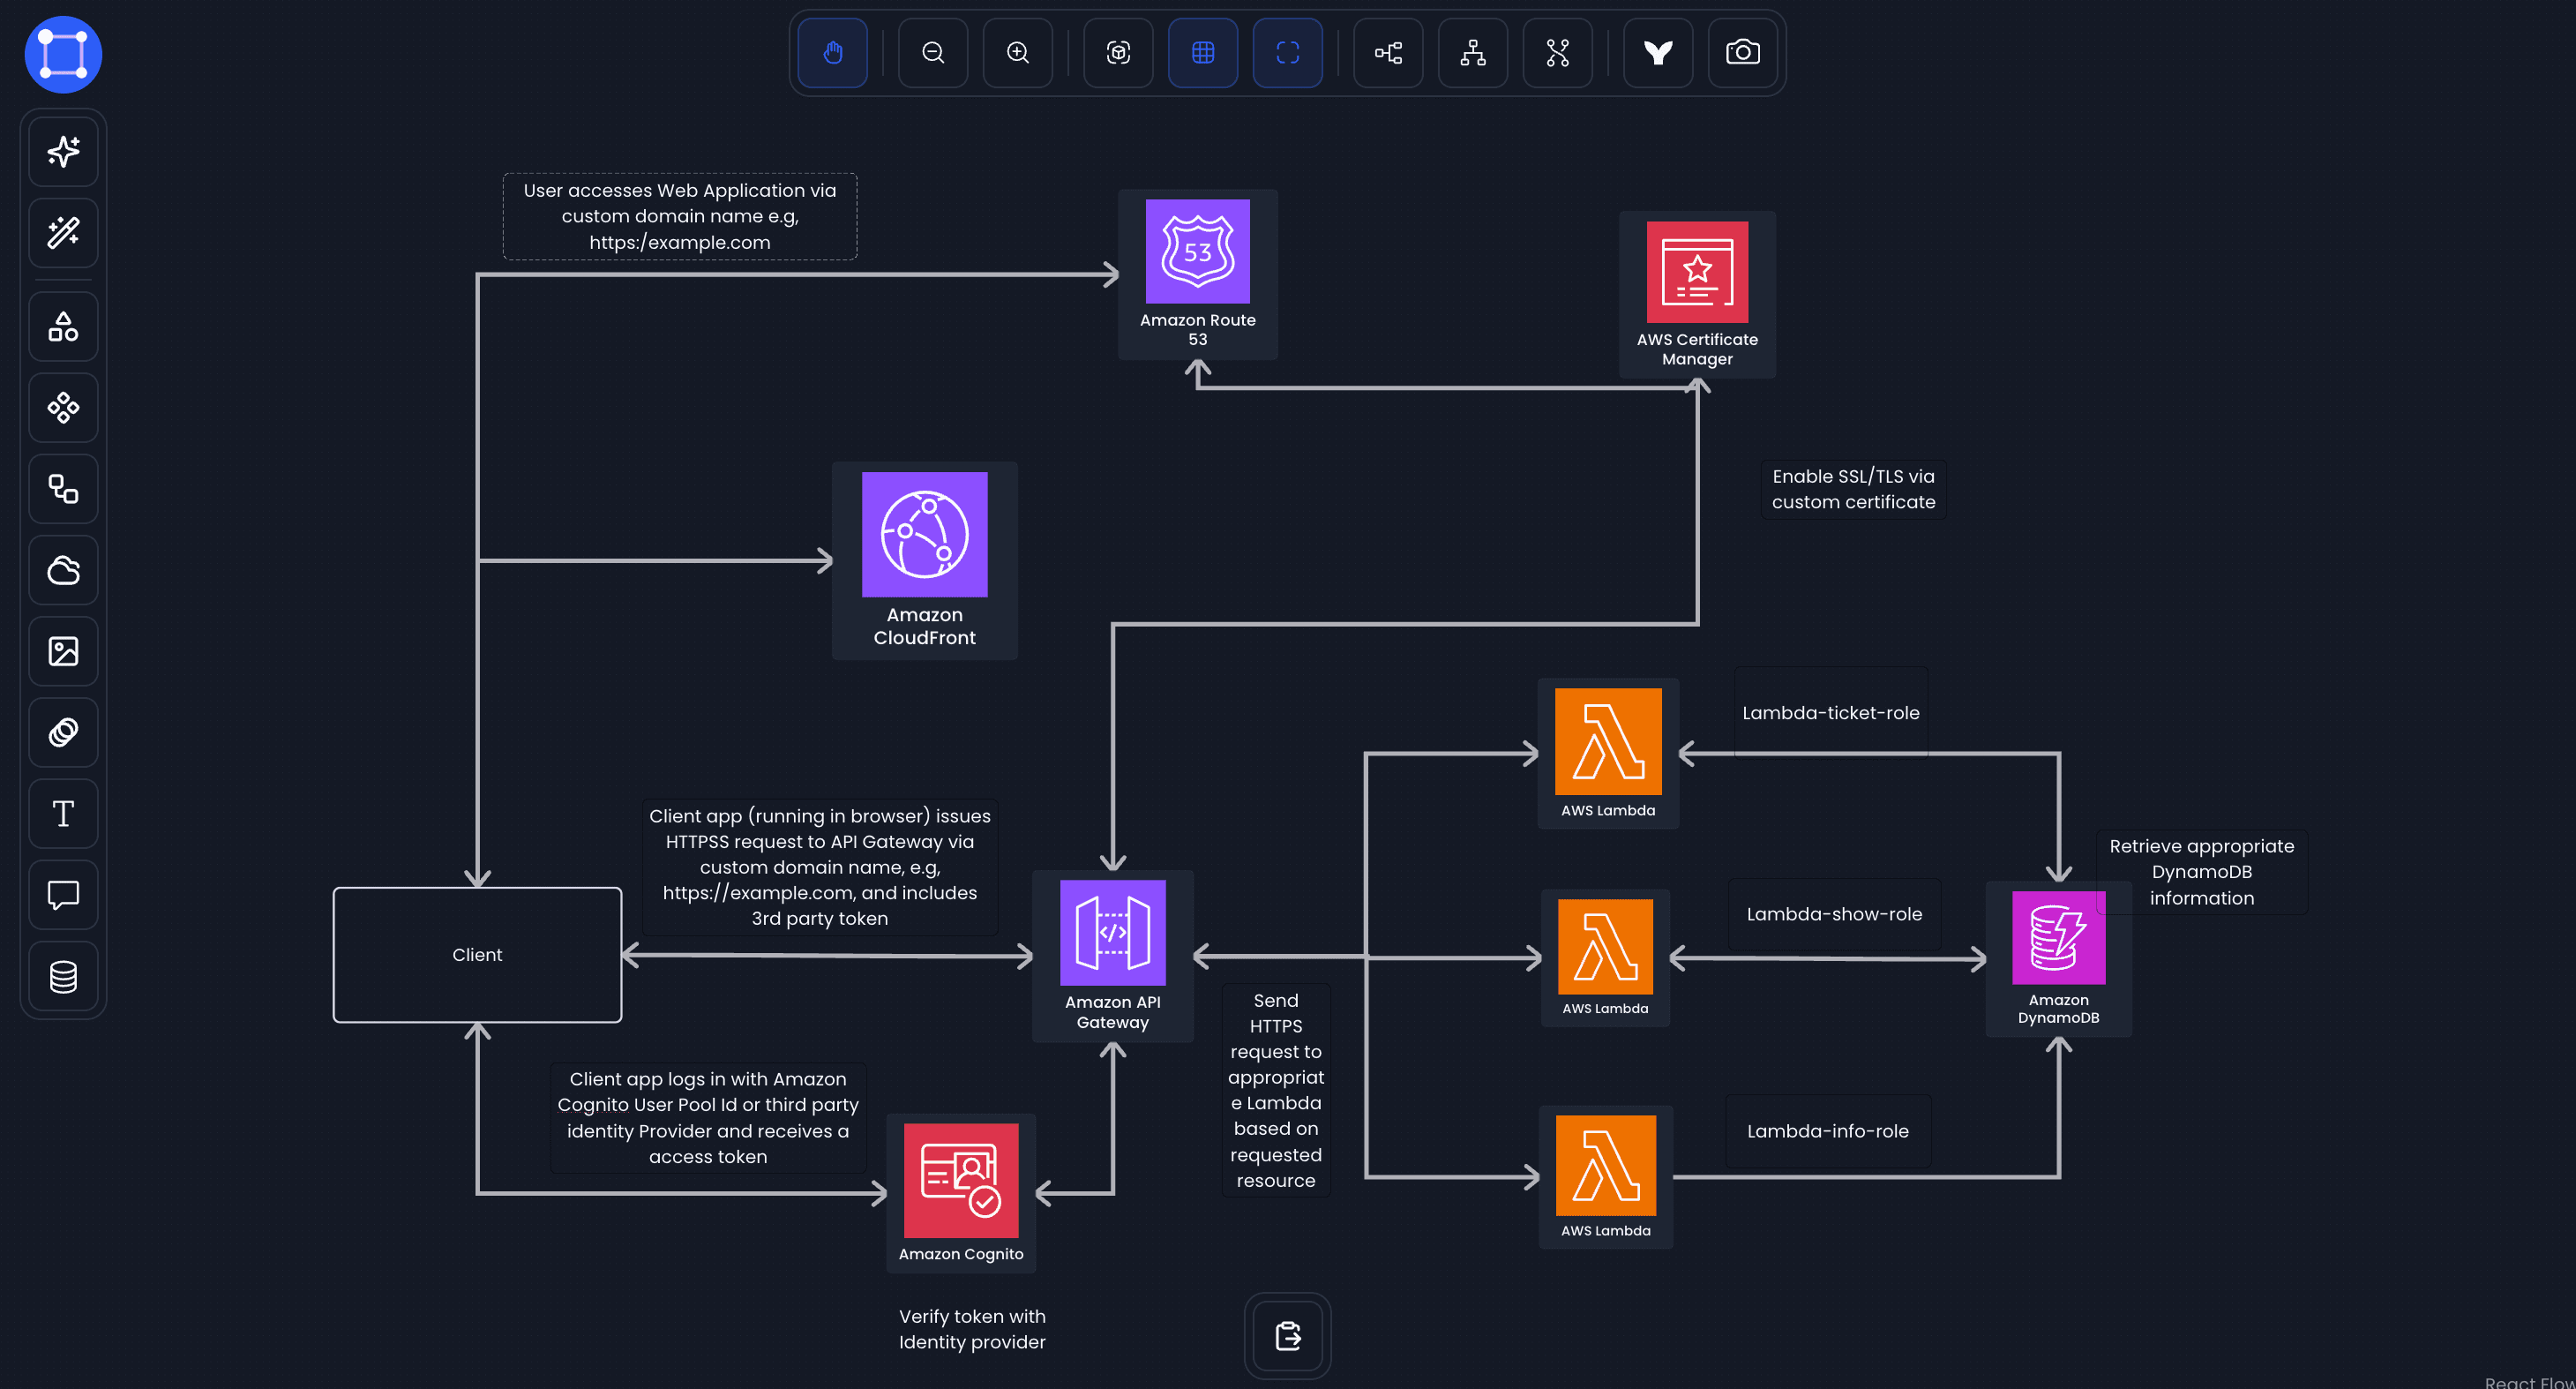
Serverless request flow. Catalog components on the canvas. Click a node, see the fields behind it.
The context behind
every component.
Add descriptions, configuration, and code to diagram components. Select a component to explore its details while keeping the surrounding flow in view.
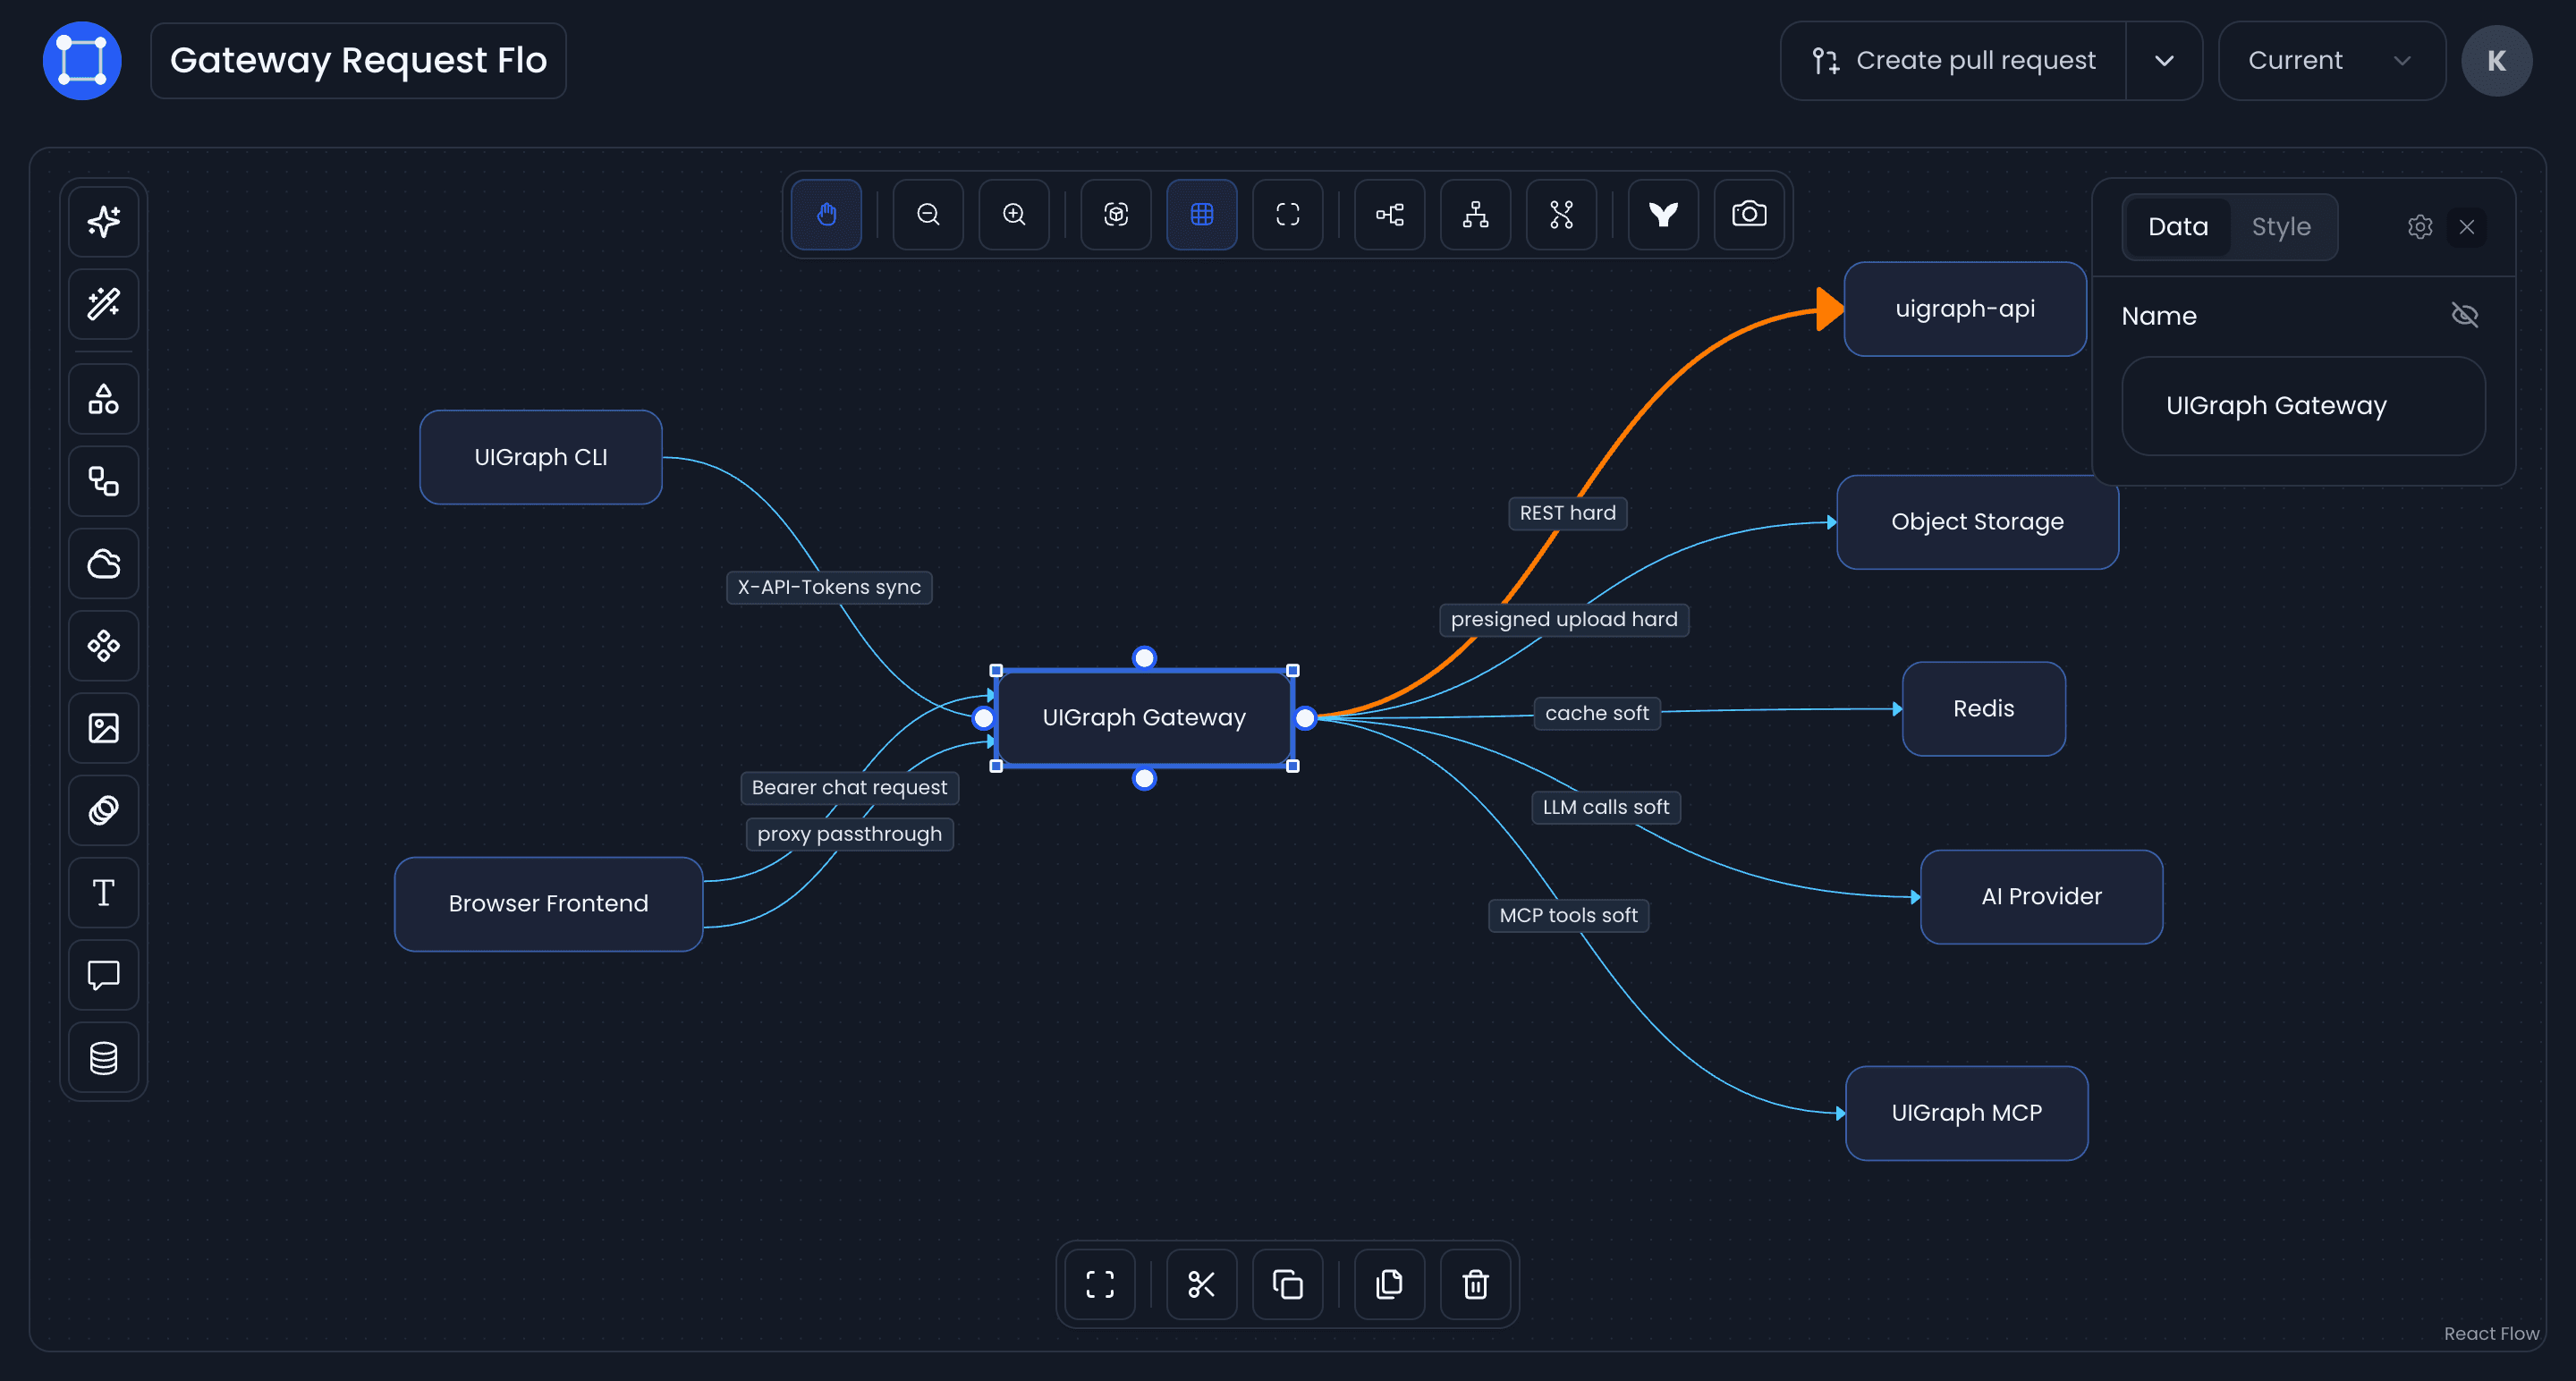
Click any node on the canvas to open its data panel.
From repo to canvas.
And back.
Sync your Mermaid diagrams and component context from your repo into UIGraph. Make changes on the canvas and create a pull request to bring them back into your repo.
# architectureDiagrams
architectureDiagrams:
  - name: Checkout flow
    path: ./docs/checkout-flow.mmd
    contextPath: ./docs/checkout-flow.context.json
  - name: Gateway request flow
    path: .uigraph/diagrams/gateway-request-flow/gateway-request-flow.mmd
Synced on deploy
· checkout-flow.mmd → canvasDescribe it.
Build on it.
Create a diagram from a prompt, then edit it on the canvas. Choose a style preset or describe the look you want to adjust its colors, layout, and grouping.
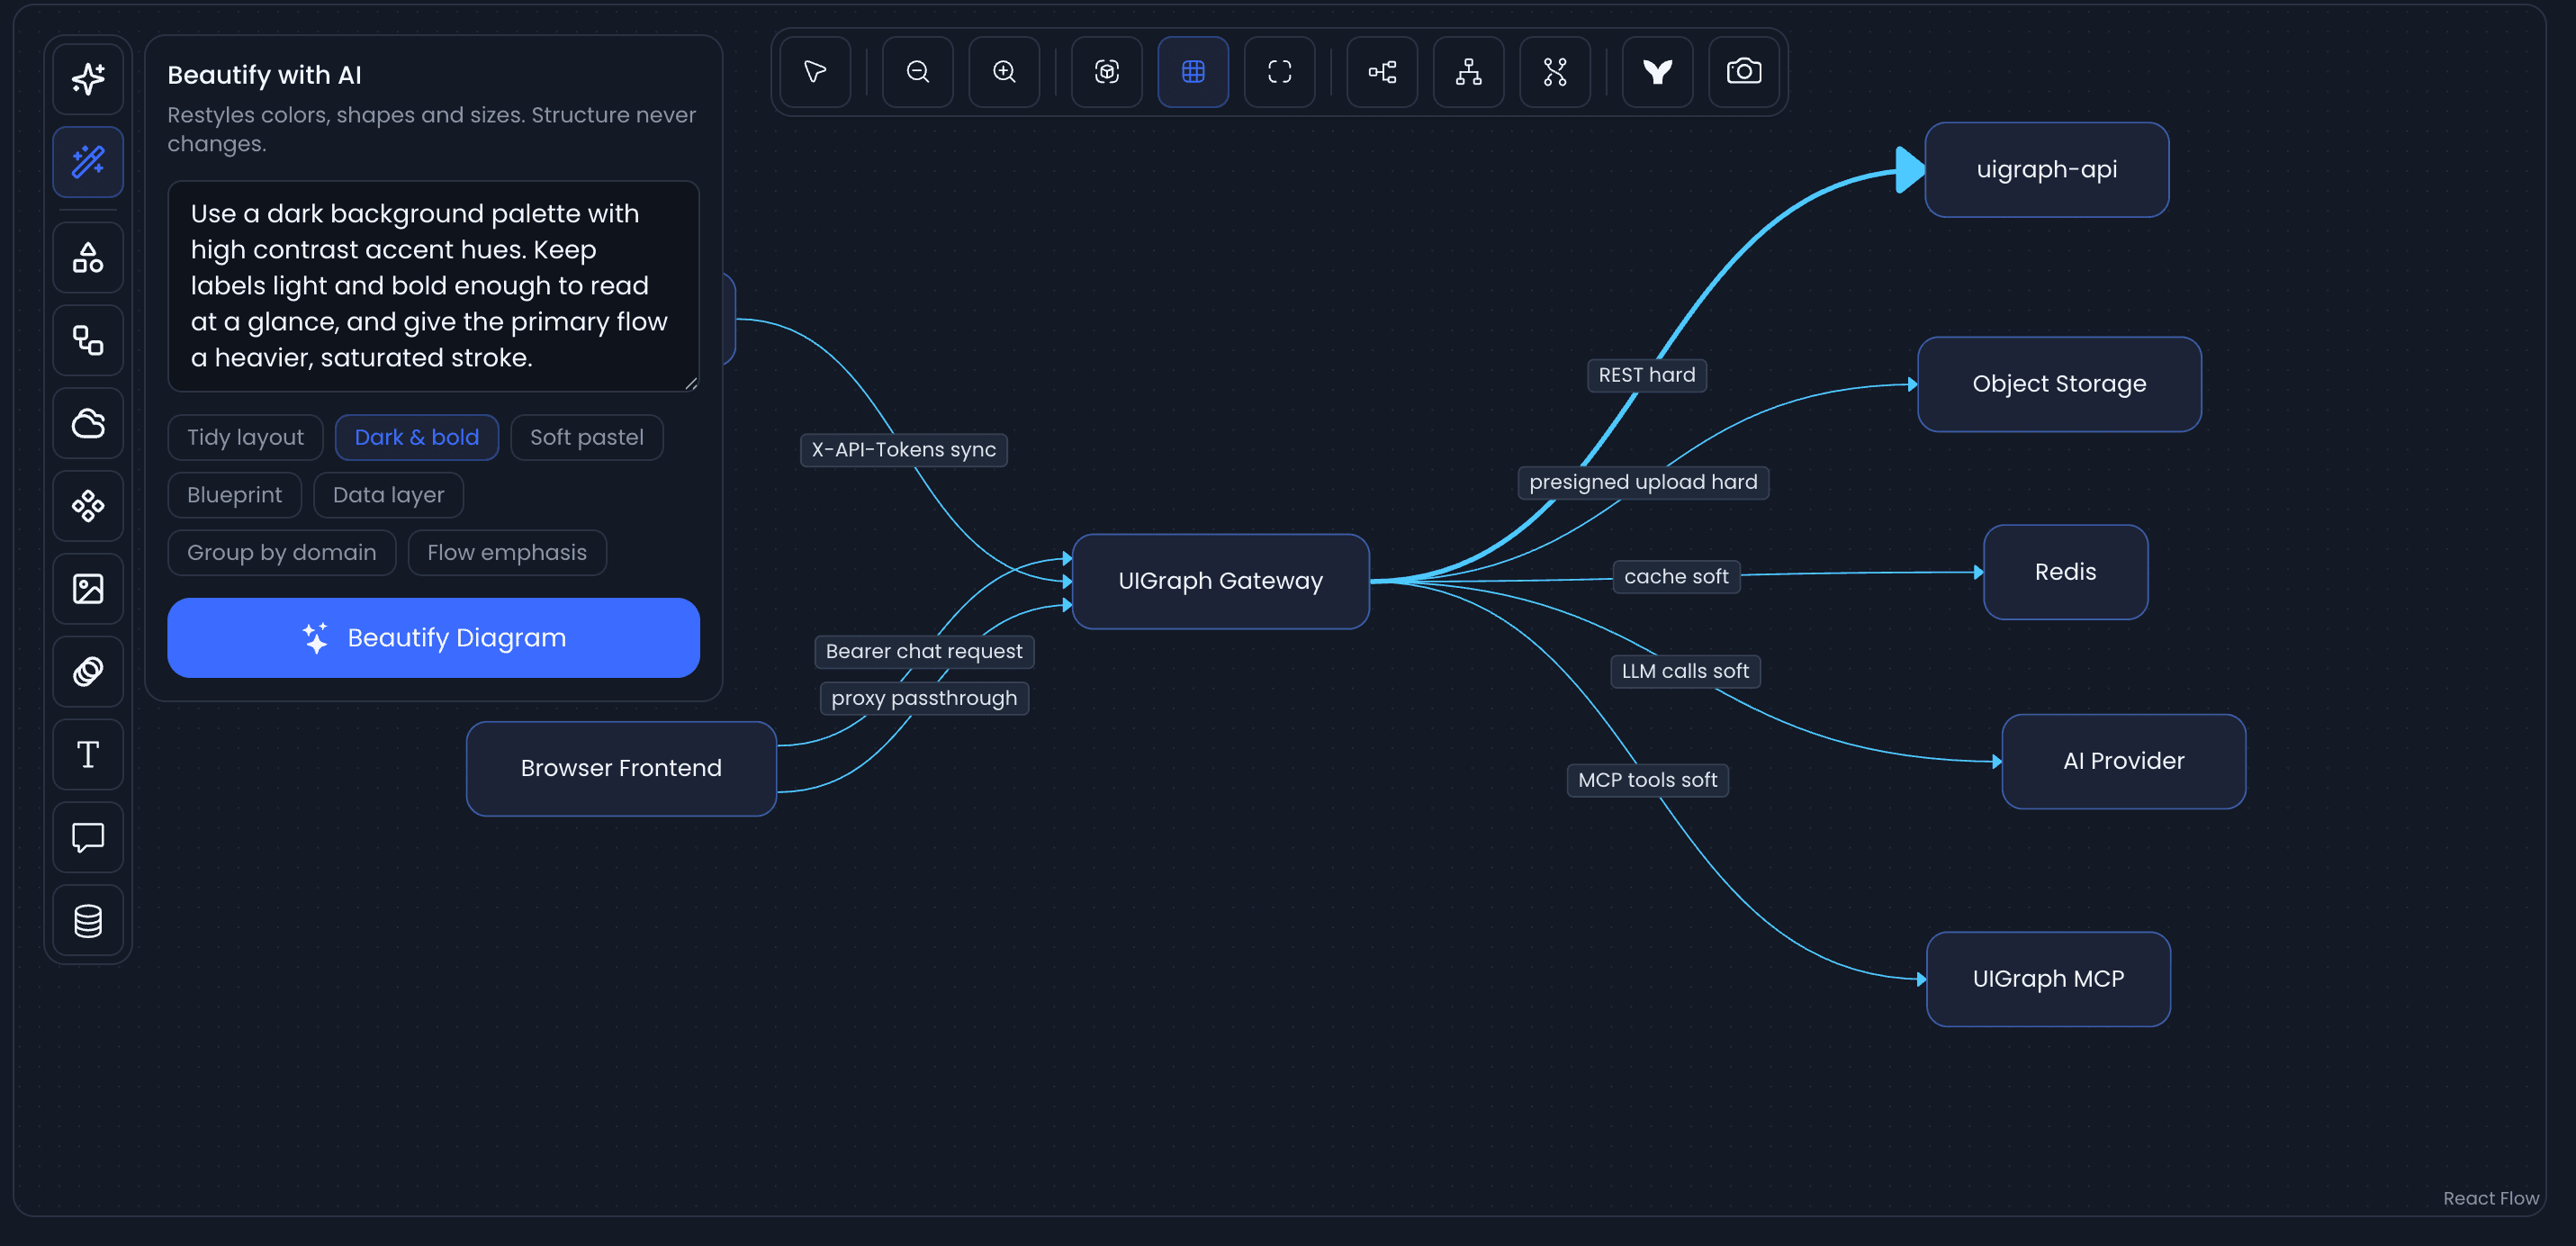
Generate with AI
Type a simple prompt. AI selects the correct diagram type and builds the initial canvas instantly.
Beautify with AI
Pick a preset — Dark & Bold, Soft Pastel, Blueprint — or describe the style in plain English. Restyles color, layout, and grouping. Structure never changes.
Check for drift
when you sync.
The UIGraph artifacts agent checks code changes against the diagrams listed in your UIGraph YAML file. Use dry-run mode to see what needs updating without changing any files.
Caught on every sync
A microservice is deprecated
The catalog component on the canvas no longer describes the service in the repo.
- component: inventory-svc
An edge is removed from the code
The diagram still draws a call that the current commit does not make.
- checkout-service → payments-api
A database table gets renamed
The field on the node still points at a name the schema no longer uses.
- table: users_v1+ table: users
Bring your diagrams
into the conversation.
Give coding agents access to your diagrams and component context through MCP. In Slack, your team can ask how a flow works and see the relevant part of the diagram alongside the answer.
For coding agents
What does Payment Succeeded lead to?
Same answer in Claude, Cursor, or GitHub Copilot — same graph the canvas already has.
get_diagram("checkout-flow")
→ context.json · nodes · edges
For your team, in Slack
Ask the diagram in Slack
Tag @UIGraph in any channel. Questions like "Which service handles Payment Succeeded events?" or "What databases touch the Auth flow?" get answered where your team already works.
Diagram slices in the thread
The reply is not text alone. UIGraph embeds the exact diagram slice that explains the flow directly in the conversation.
Grounded in code
AI Assist answers from your active, synced context. Same data the canvas reads, not a wiki page from last quarter.
Your next diagram
starts here.
Start with a blank canvas, a prompt, or a Mermaid file. Add the context that makes it yours.