Understand your AIusage and costs.
Track agent activity, compare costs and estimated savings, and see which repositories and services the work relates to.
Insights is available by request on cloud and can be enabled explicitly when self-hosting.
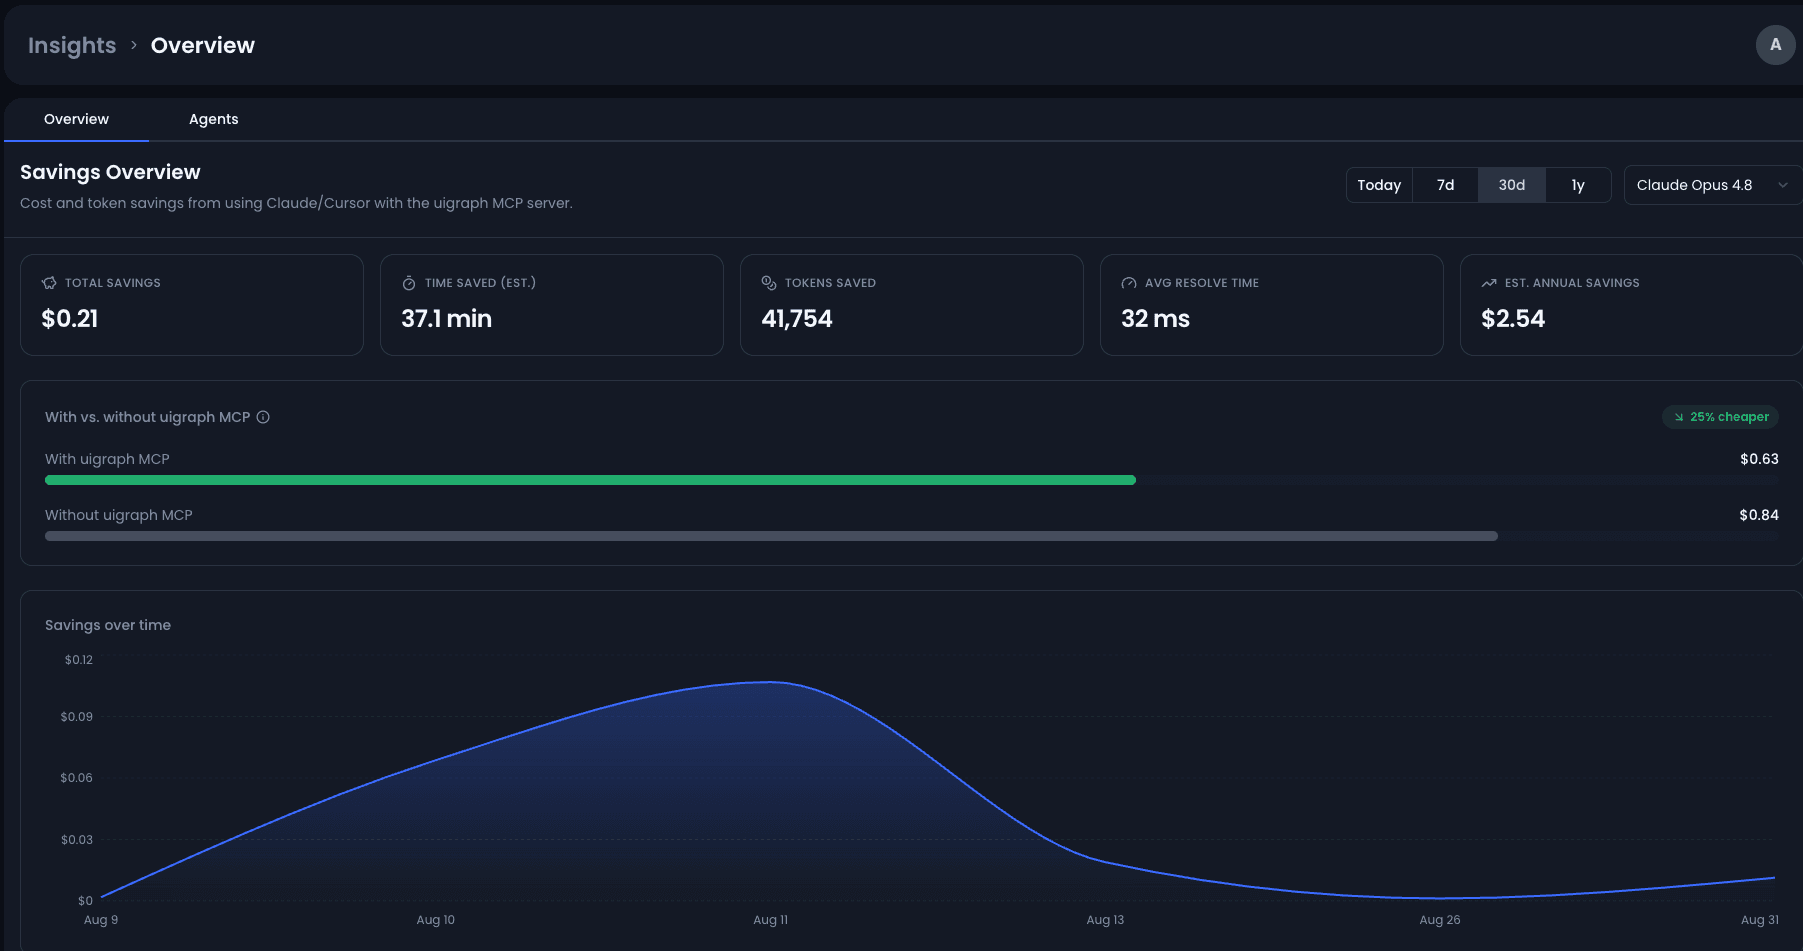
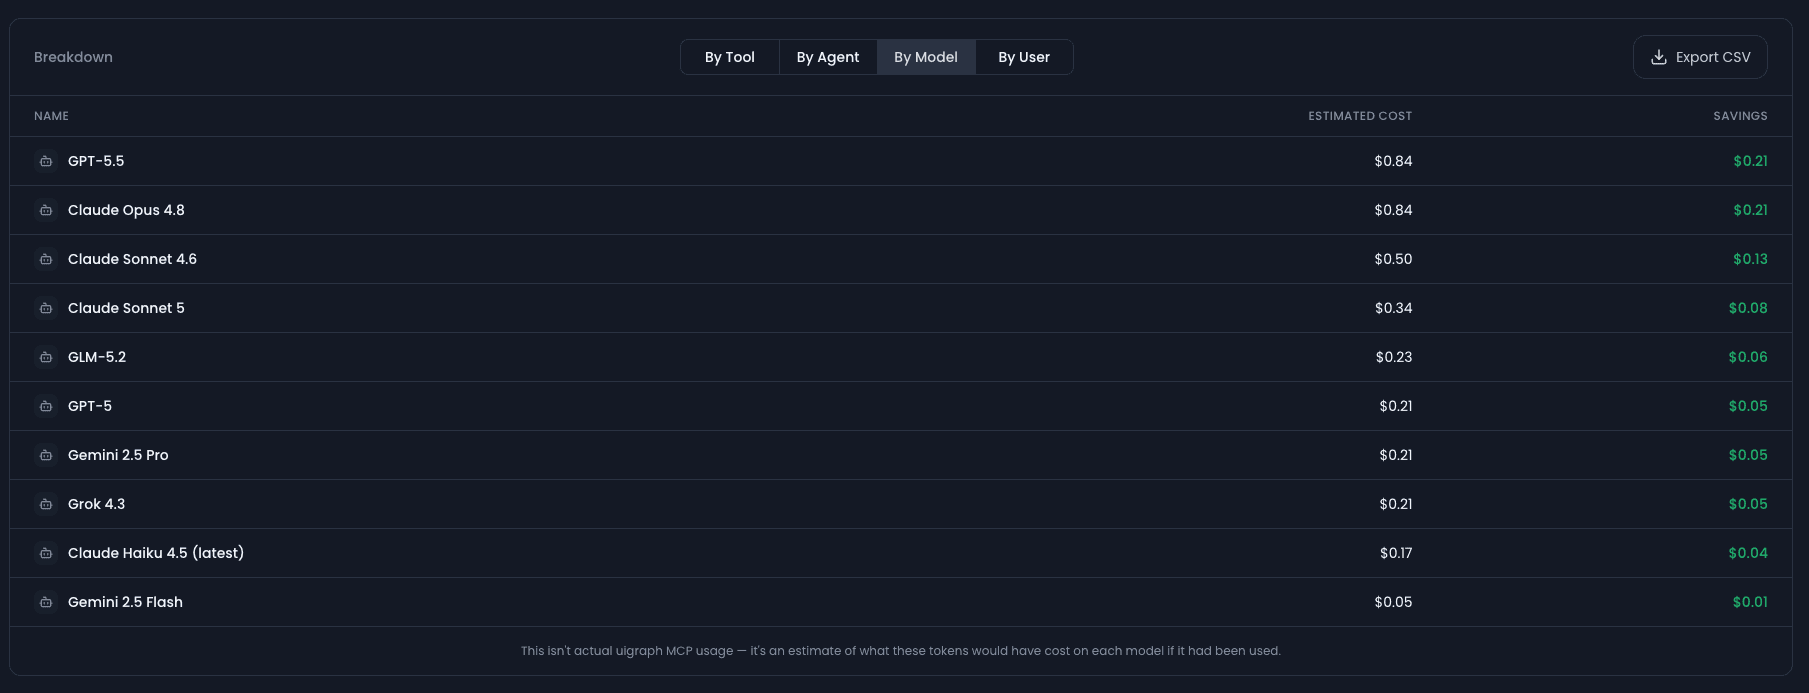
Spend on one side. Measured work on the other.
Compare connected tool billing with savings estimates based on recorded agent sessions.
01SessionThe agent run and the work it produced
02RepositoryThe codebase where that work landed
03ServiceThe system component declared in the graph
04ContextOwner, APIs, dependencies, and attributed cloud cost
See where your
agents worked.
Explore recorded agent sessions alongside their associated repositories and services. Follow those connections to see ownership and dependencies for more context.
Frequently asked questions
Still have a question about Insights? The docs cover sessions, attribution, and availability in detail.
Read the docsAvailable by request on cloud and enabled explicitly when self-hosting.
Take a closer look
at your AI activity.
Explore recorded sessions, costs, and estimated savings with UIGraph Insights.