UIGraph connects services, APIs, database schemas, architecture diagrams, product screens, and tests in one view of your software system. Engineers can explore how components fit together, trace product features to their implementation, and give coding agents access to system information through MCP.
As software systems grow, understanding how everything fits together becomes harder. Service ownership, API specifications, database schemas, architecture diagrams, and tests often live in different places. Engineers have to piece them together when debugging issues, reviewing changes, or working on unfamiliar parts of the system.
Coding agents face a similar challenge. They can read and modify code, but understanding the relationships between components often requires information beyond the files they are working with.
What can you do with UIGraph?
Explore services, APIs, and dependencies
Understand what each service does, which APIs it exposes, what data it uses, and how it connects to other services. Explore architecture diagrams, database schemas, documentation, and test packs alongside the components they describe.
Connect product screens to implementation
Start with a product screen instead of a service or API.
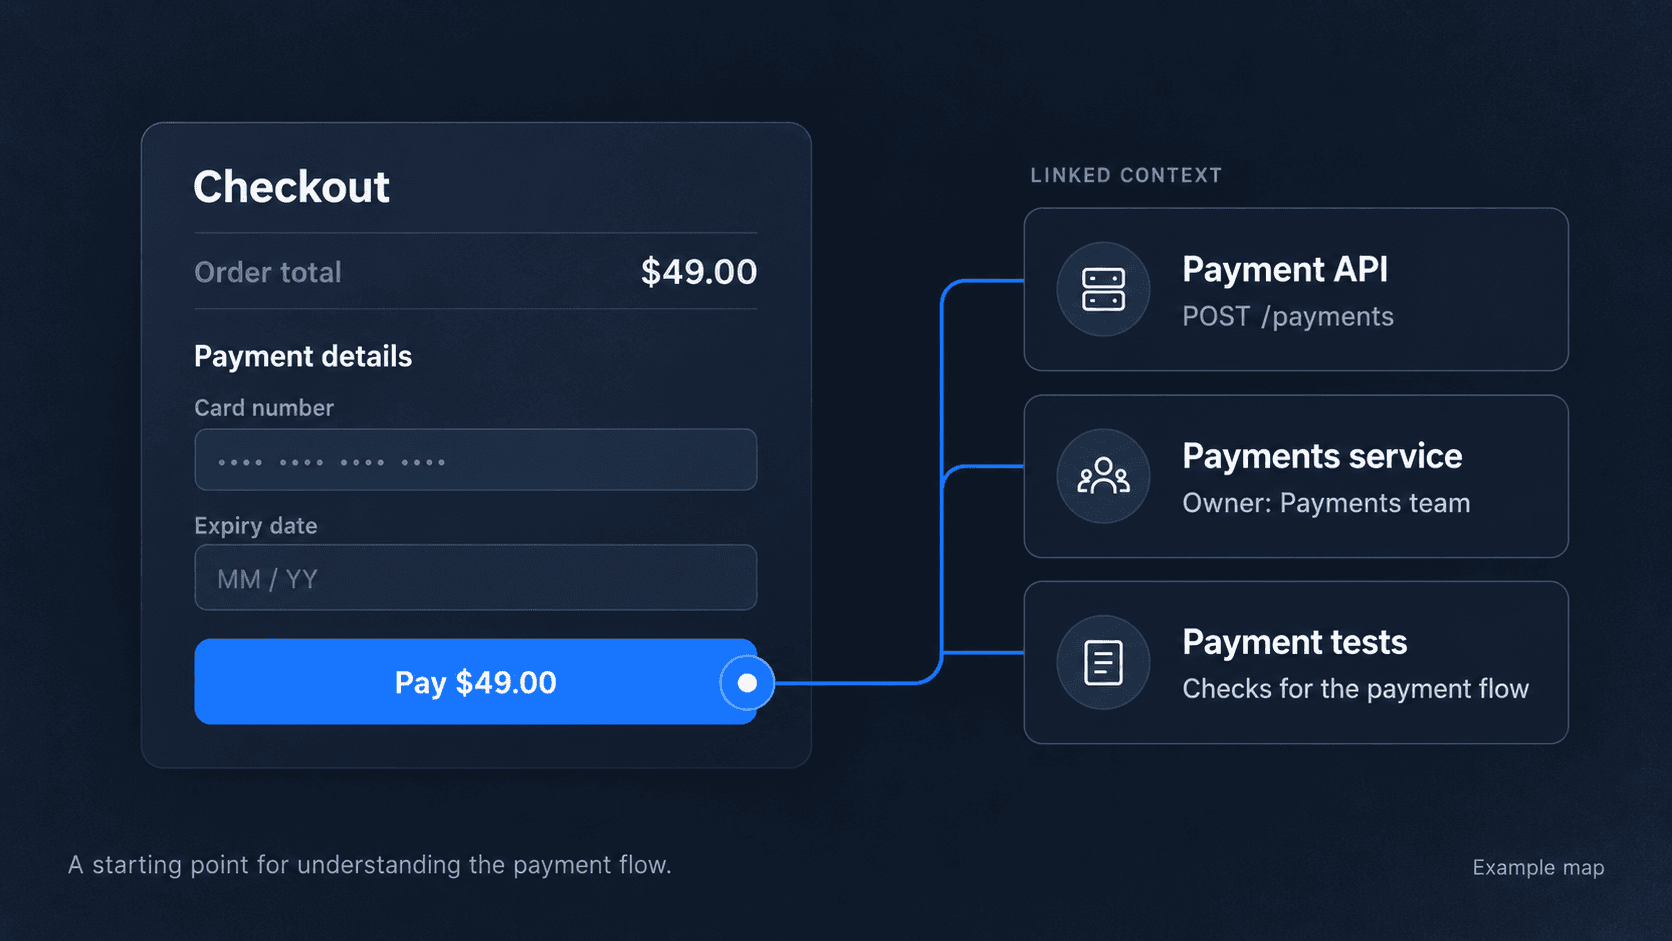
UIGraph's system maps let you place focal points on specific regions of a screen, such as a button, form, or page section. Link each point to the APIs, services, diagrams, and tests associated with that part of the product.
When someone needs to understand what happens behind a particular interaction, they can start at the screen and follow its connections into the implementation.
Make system information available to coding agents
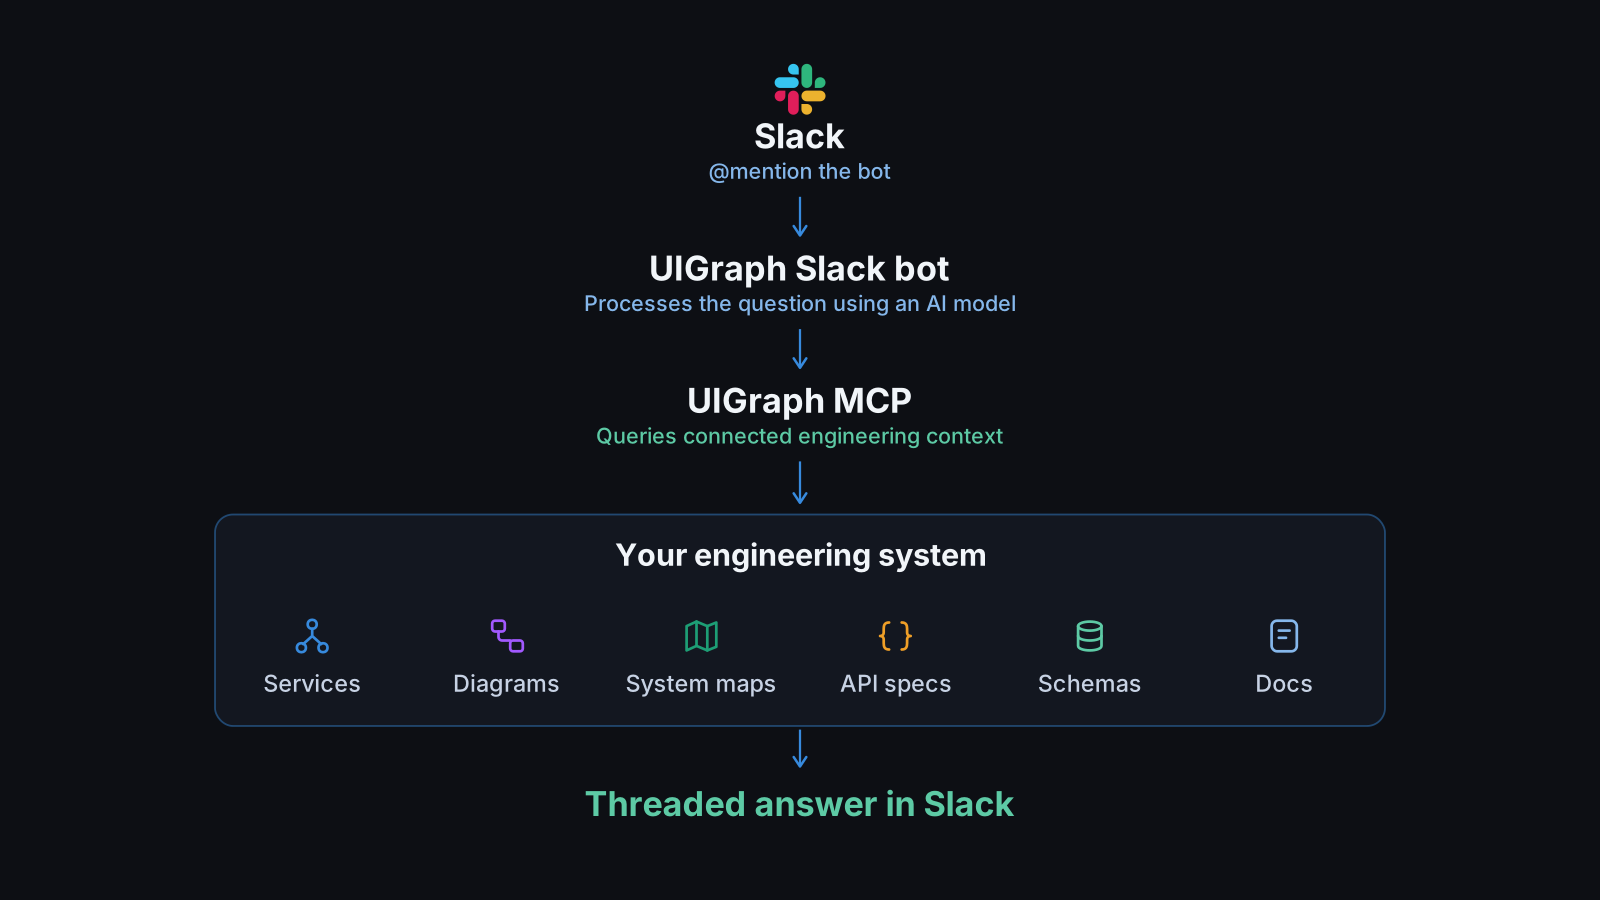
UIGraph's MCP server lets coding agents retrieve available service information, API specifications, schemas, diagrams, and other engineering artifacts.
Supported clients include Claude Code, Cursor, Codex, OpenCode, Windsurf, Gemini, VS Code, and Claude Desktop.
How does UIGraph work?
1. Bring your engineering artifacts together
UIGraph works with engineering information your team maintains, including service metadata, OpenAPI specifications, dependencies, architecture diagrams, database schemas, test packs, and documentation.
A .uigraph.yaml file declares a service and the artifacts associated with it. For example:
version: 1

service:
  name: Reporting Service
  category: Backend
  description: Generates application reports
  repository:
    provider: github
    url: https://github.com/company/reporting-service
You can extend this configuration with references to supported artifacts as your needs grow. The UIGraph CLI synchronizes the declared information, and uigraph-cli sync --dry-run previews what would be sent without writing anything to UIGraph.
See the UIGraph CLI documentation for the configuration format and supported artifact types.
2. Explore the system visually
UIGraph provides different ways to explore your software, depending on the question you need to answer.
- Service catalog: Inspect services, ownership, APIs, schemas, dependencies, and associated artifacts.
- Architecture diagrams: Explore C4 diagrams, sequence diagrams, and system flows.
- Database models: Visualize supported SQL and NoSQL data structures.
- System maps: Start from product screens and follow focal points into the underlying implementation.
For example, an engineer investigating a reporting issue can start with the reporting service, inspect the APIs and data structures it uses, and follow its documented dependencies to understand where the problem might originate.
3. Give coding agents access through MCP
Consider a coding agent tasked with modifying a reporting service. The relevant source files may explain how to implement the change, but the agent may also need to understand documented consumers of the reporting API, the schemas involved, and the architecture diagrams describing the affected flow.
With UIGraph MCP configured, the agent can retrieve available system information to supplement what it discovers in the repository.
Learn how to connect your coding agent to UIGraph.
Keeping artifacts aligned with your code
Engineering artifacts are useful only when they accurately describe the system.
UIGraph supports a repository-based workflow for declaring and synchronizing artifacts through .uigraph.yaml and the CLI. Teams can run synchronization as part of their CI/CD pipelines and use dry runs to review proposed changes before applying them.
Sync publishes what your team maintains. Reviewing whether those files still describe the system remains part of the work.
Who is UIGraph for?
- Software engineers: Understand unfamiliar services, APIs, schemas, and dependencies before making changes.
- Senior and staff engineers: Explore system architecture and investigate the impact of changes across components.
- QA engineers: Explore documented test packs and their links to APIs and implementation details.
- Product and design teams: Trace screens and interactions to the services and APIs behind them.
- Teams using coding agents: Give agents access to documented system relationships through MCP.
Getting started
Start with one service or product flow. Add its metadata and relevant artifacts to .uigraph.yaml, preview the sync with the CLI, and explore the result in UIGraph.
If you use coding agents, configure MCP to make available system information accessible from your development environment.
You can also run UIGraph on your own infrastructure. Visit the UIGraph documentation for setup and deployment instructions.
See how your system fits together
Explore UIGraph to connect your engineering artifacts and make system relationships easier to understand.